
NIQ (NielsenIQ)
Turning complex retail data into actionable business decisions
Retail Analytics / BI
- Retail Analytics
- BI
- Decision Support
- Data Visualization
- Complex Systems
- Enterprise UX
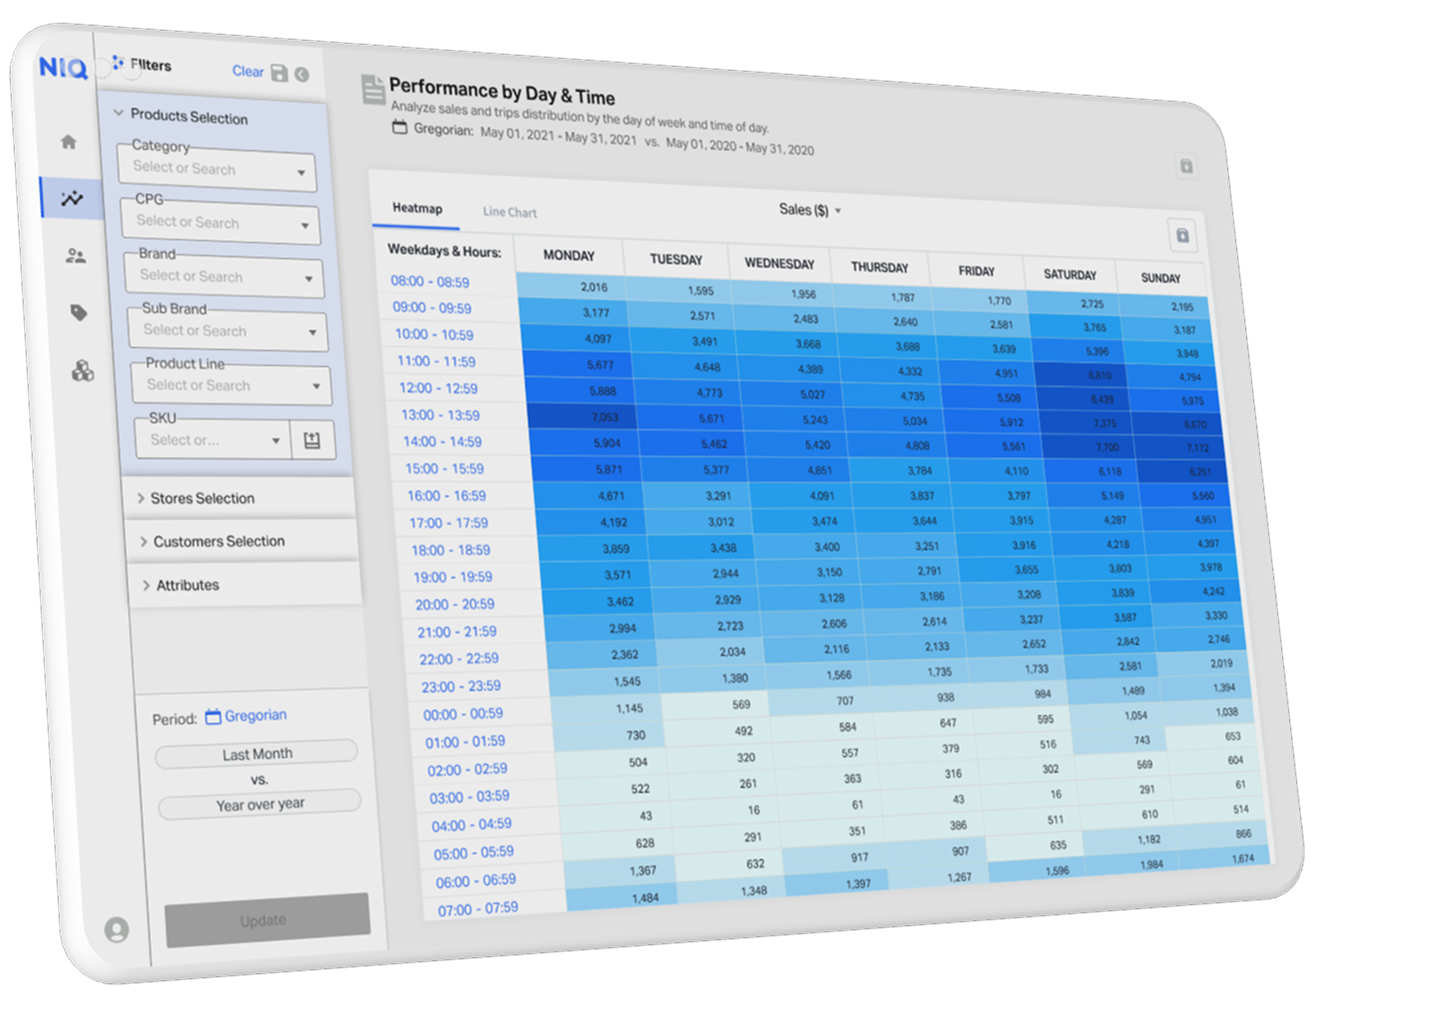
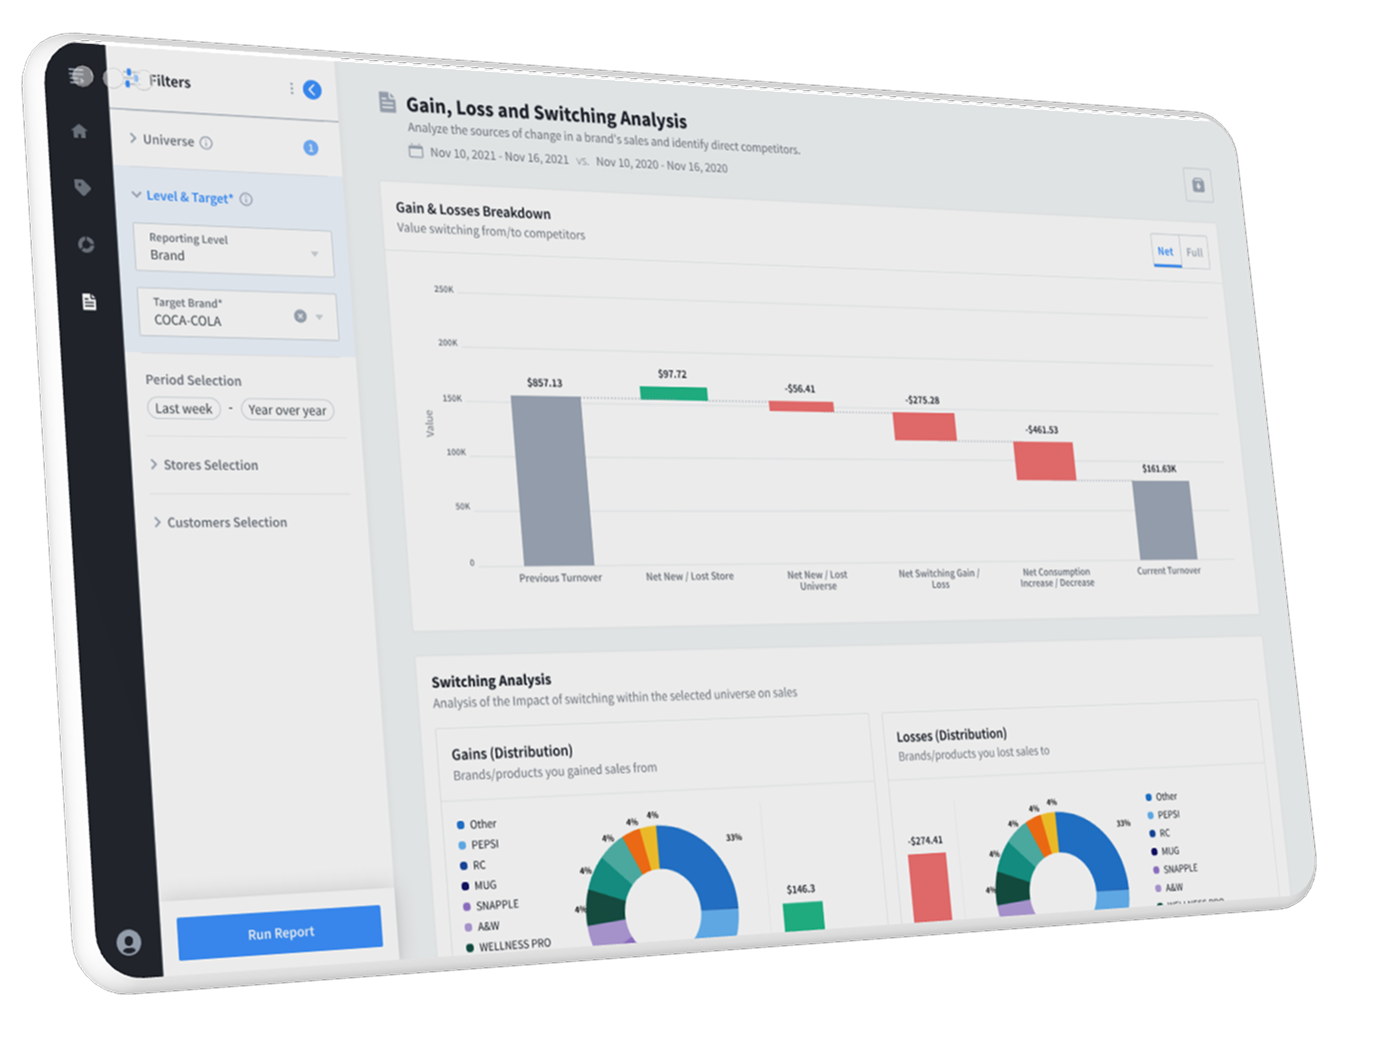
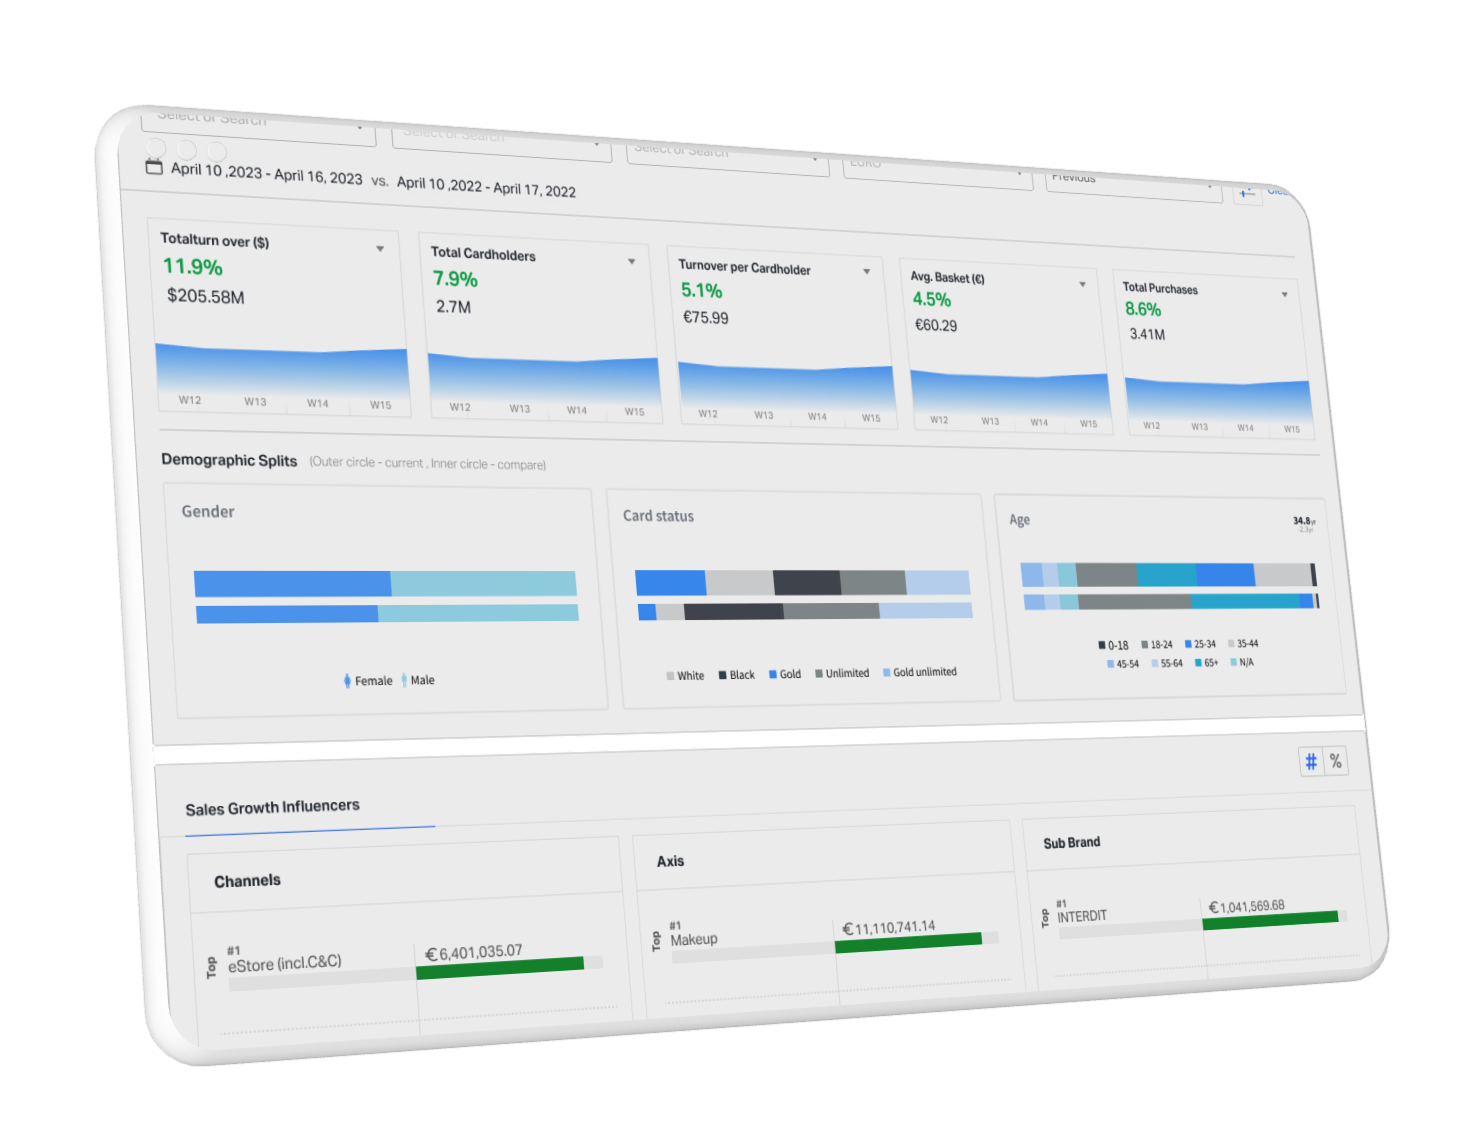
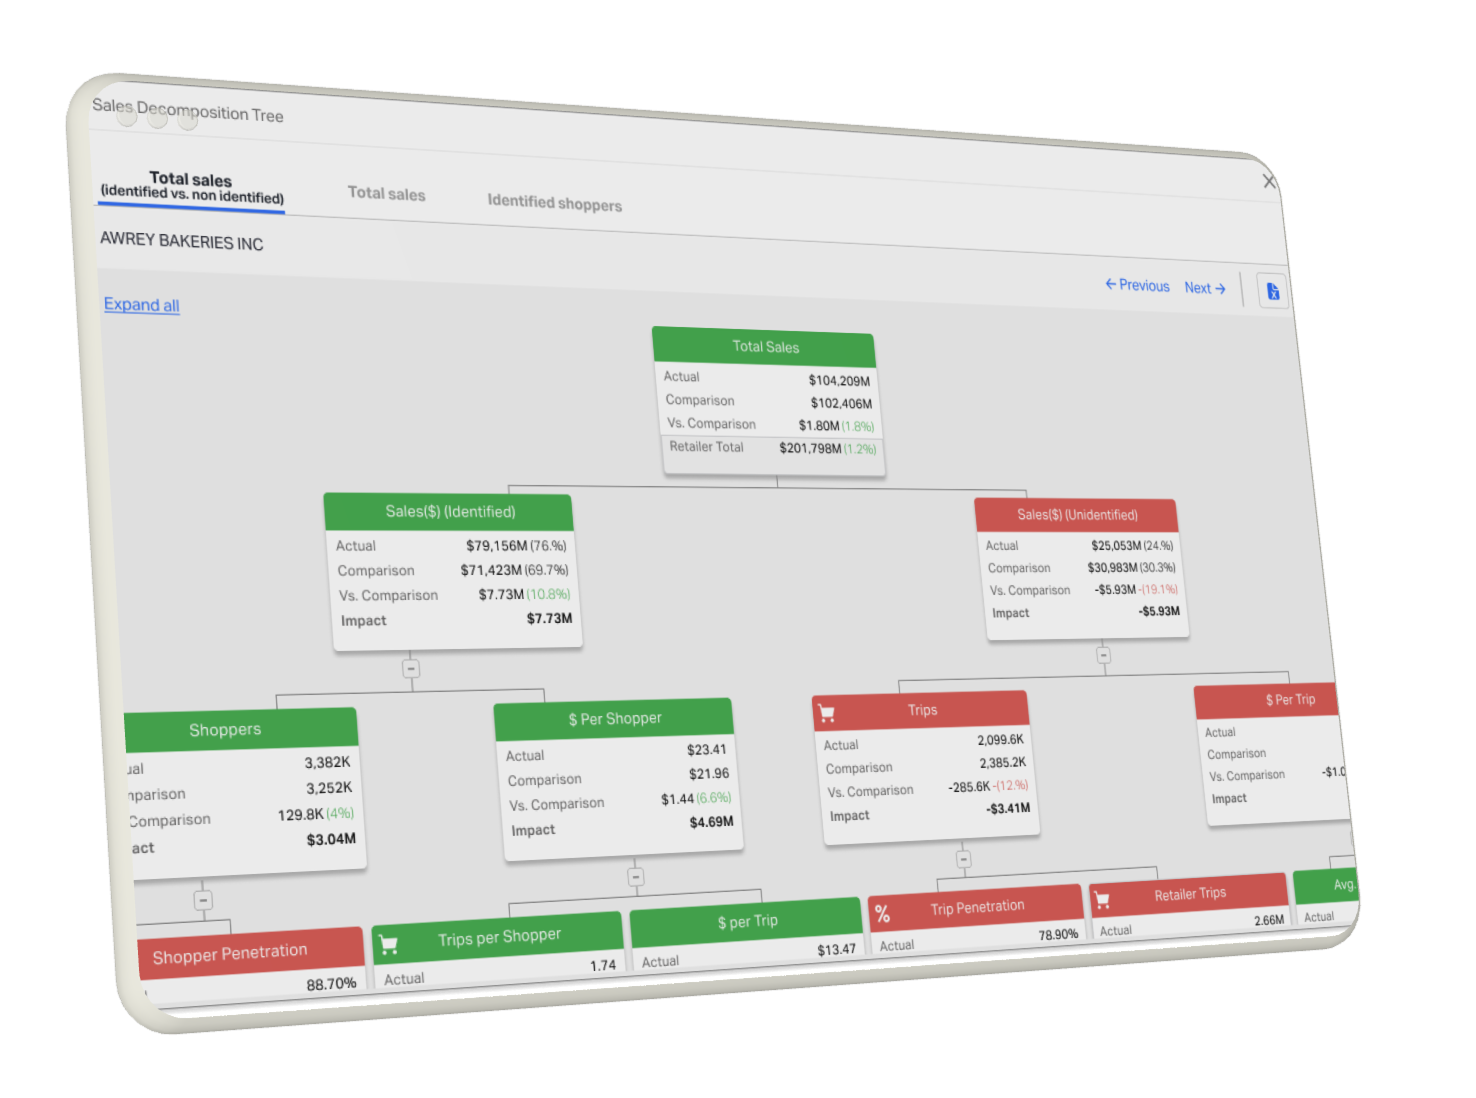
Overview
NIQ (NielsenIQ) provides market measurement and consumer intelligence used by retailers and consumer goods companies to understand market performance.
ZingUI worked on BI and Decision Drivers solutions for the retail industry, focused on the analytical workflows business users follow when investigating performance.
The Challenge
Retail and consumer goods professionals work with large volumes of market, sales and performance data.
The challenge was to help users move beyond viewing data and quickly understand what is driving performance, where opportunities exist and what actions should be considered.
The Solution
ZingUI worked on BI and Decision Drivers solutions for the retail industry, simplifying complex analytical workflows and helping users navigate from high level business indicators into the underlying factors driving results.
The work combined product thinking, information architecture, complex data UX, visualization and interaction design to make sophisticated analytics easier to understand and act on.
The Approach
Product Strategy
Defining the analytical questions the product should answer first.
System Analysis
Understanding measures, dimensions and the structure of retail market data.
Functional Architecture
Designing navigation from headline KPIs down into contributing drivers.
UX
Complex data UX for exploration, comparison and segmentation.
Prototyping
Validating analytical journeys with realistic data structures before build.
The Impact
Created clearer paths from data to insight, helping users identify meaningful business drivers and make more informed decisions based on complex retail data.
What We Learned
- Analytics products succeed when they answer 'why', not only 'what'. A chart that reports a decline without exposing its drivers still leaves the work to the user.
- Progressive depth beats dashboard density: start with the business indicator, then let users descend into the factors behind it.
Understanding the domain
What are Decision Drivers?
Decision Drivers help users understand the factors behind changes in business performance rather than simply presenting the numbers themselves.
By connecting KPIs with the underlying drivers, users can move from identifying what happened to understanding why it happened and where action may be required.
How does BI support retail decision making?
Retail BI systems bring together large volumes of sales, market and performance data and transform them into information that business users can explore and act on.
Effective retail analytics should help users identify trends, understand performance drivers, compare results and discover opportunities without requiring them to manually analyze large datasets.